|
Population Demographics
Population (Mid 2012): 30,136,000 Density ( people per square km.): 23 Net Migration Rate (# per 1000 people): -4 Birth Rate ( # per 1000 peope): 20 Death Rate ( # per 1000 people): 5 Rate of Natural Increase: 1.5% Population Growth Rate: 1.1 Infant Mortality Rate ( # of deaths per 1000 live births): 17.0 Total Fertility Rate ( average # of children per women): 2.6 Population Age <15: 30% Population Age 65+: 6% Dependency Rate ( add together Population Age <15 % and Ages 65+ %): 36% Life Expectancy at Birth (total): 74 Life Expectancy at Birth Females:76 Life Expectancy at Birth Males:71 Primary School Completion Rate Females: 101% Primary School Completion Rate Males: 101% Secondary School Enrollment net Females: 75% Secondary School Enrollment Net Males: 75% GNI PPP per capita in US$: $8,120 Population Living Below US$2 per day: 15% Economically Active Females 15+: 58% Economically Active Males 15+: 76% Mobile Phone Subscribers ( # per 100): 73 Motor Vehicles ( # per 1000): 55 Undernourished Population: 12% Underweight Children Under Age 5: 8% HIV/AIDS Among People Ages 15-49: 0.4% |
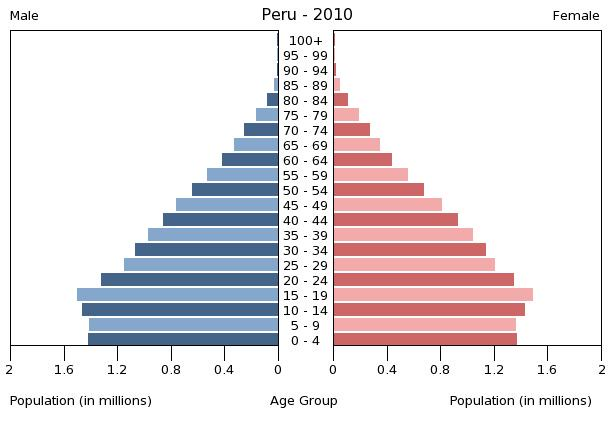
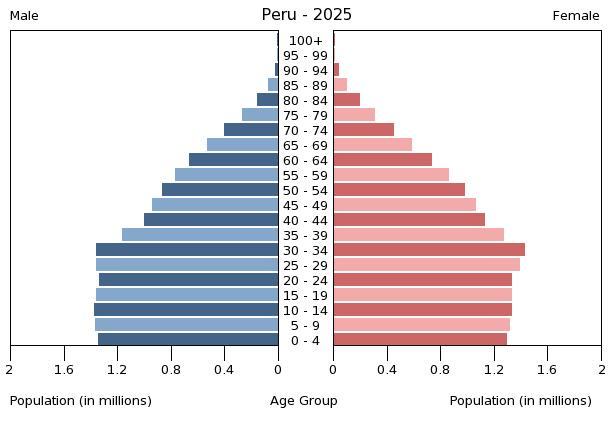
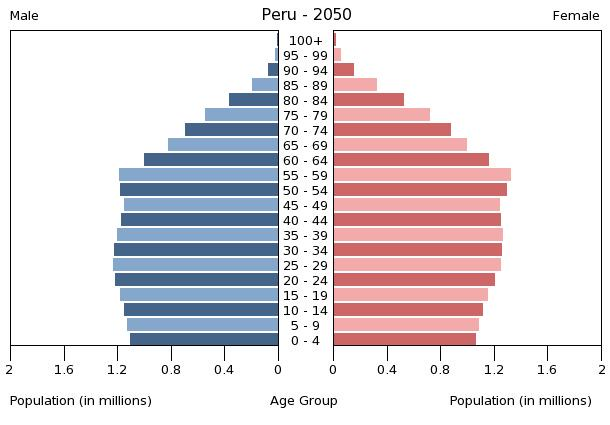
Population Pyramids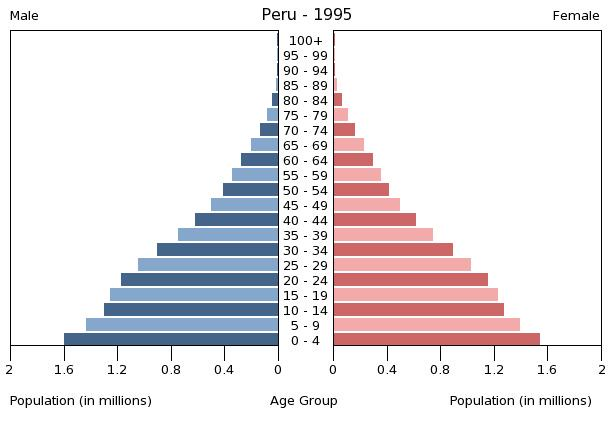
|
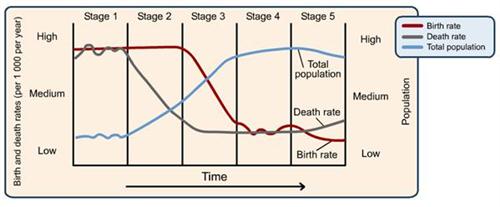
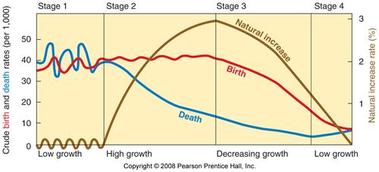
Demographic Transition Model
|
|
Peru is currently in stage 2-3 of the Demographic Transition Model. The high birth rates correspond with very low death rates, and the rate of Natural Increase is relatively high at 1.5%. The population growth is a steady increase, and the average life expectancy corresponds to the expected age for stages 2 to 3. All characteristics of Peru more or less match the criteria for stages 2 to 3. Although one could argue for a stage 4 transition, a greater case is made for the associaiton with stages 2 to 3.
